
Arbitrage
Get started
জয় শ্রী রাম
🕉Suppose you are given a set of exchange rates among certain currencies and you want to determine if an arbitrage is possible, i.e, if there is a way by which you can start with one unit of some currency C and perform a series of barters which results in having more than one unit of C. Let's assume that
- transaction costs are zero
- exchange rates do not fluctuate
- fractional quantities of items can be sold

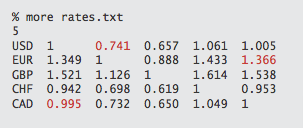
The above picture shows such chart.
Let's see what happens if I get exchange currency in the following sequence :
USD -> EUR -> CAD -> USD
Let's suppose we start with 10000 USD then exchange it for EUR. We get 7410 EUR. Now I want to exchange this with CAD.
7410 EUR = 7410 * 1.366 = 10122 CAD
Now let's exchange this for USD.
10122 CAD = 10122 * 0.995 = 10071
There you go. We started with 10000 USD and ended up having 10071 USD. That is a good 71 USD profit. Design an efficient algorithm to determine whether there exists an arbitrage - a way to start with a single unit of some currency and convert it back to more than one unit of that currency through a sequence of exchanges.
Solution:
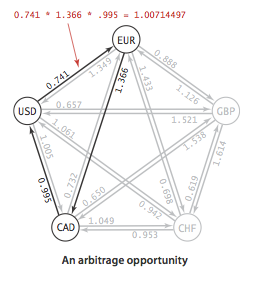
Drawing pictures would be a great start for solving this problem.The relationships between the currencies can be represented using a graph: currencies will correspond to vertices, exchanges correspond to edges, and the edge weight is set to the exchange rate as shown below.

Let's we have two currencies A and B and let's consider the below few scenarios:
-
let's suppose exchange rate A -> B = 1.5 and B -> A = 0.6667
Note that the product of the exchange rates 1.5 * 0.67 = 1.
So if we exchange 1 unit of A with B and whatever we get we again convert to A we get 1 unit of A back. -
Now let's suppose exchange rate A -> B = 1.5 and B -> A = 0.5
Multiplication of exchange rates = 1.5 * 0.5 < 1
In this case if we convert 1 unit of A into and then convert back to A, we will end up with less than 1 unit of A even though we started with 1 unit of A, So in short we will lose in this scenario with profit < 0. - If exchange rate from A to B is 1.5 and B to A is 0.8 then since 1.5 * 0.8 > 1 and we will end up with more than 1 unit of A if we start with 1 unit of A, convert to B, and whatever we get after conversion, we convert that back from B to Profit > 0.
From our above observation, we go on converting a currency to other currencies in sequence and convert back that same current we
started with (say, we started with 1 unit of currency A and hen converted it to B, then whatever we got after the conversion, we
converted that to C and finally whatever we got from conversion to C we converted that amount from C to back to A), then whether we would make any profit or not depends on the result of the multiplication
of the exchange rates involved. If the product of the exchange rates is greater than 1 then we would make profit, if less than 1 then
loss and it is zero then we make no profit i.e, we we started with 1 unit of A then we will get back 1 unit of A.
A, B, C, A clearly creates a cycle.
From above discussion we can say that if we represent relationship between different currencies through a graph, as discussed above, then an arbitrage situation will take place when the result of the multiplication of the weights of all the edges forming the cycle is greater than 1.
Say, the exchange rate from A to B is a, B to C is b, and C to A is c.
Then we have a arbitrage only if
a * b * c > 1
In the above graph exchange rates of
USD to EUR is 0.741,
EUR to CAD is 1.366,
CAD to USD is 0.995
Multiplication of these exchange rates = 0.741 * 1.366 * 0.995 = 1.007 > 1
So, we have a multiplicative relation here. But the most common graph algorithms are not well known for representing multiplication relationships and doing something meaningful with it. But if we can convert this multiplicative relationship into some sort of ADDITIVE relationship then we could do something about. In fact, we can convert currency exchange relationship into a additive relationship where we can add the edge weights and determine if an arbitrage exists based on the sum of the edge weights of the cycle then we can re-formulate the condition to get an arbitrage as something like:
An arbitrage exists if the sum of the weight of the edges forming the cycle is greater or less than a threshold. What this threshold value would be would depend on how we convert multiplicative relationship into additive relationship.
So if we have x * y = z how can we get an additive relationship between x and y ?
We know logarithm of two or more variables results in addition of logarithm of each of these variable.
log (x * z * y) = log(x) + log(y) + log(z)
We also know
if we have a variable A then
- logA = 0 if A = 1, any positive real number to the power ZERO is ONE.
- logA > 0 if A > 1
-
logA < 0 if A < 1
Let's say A = 0.5
then we can also write A = 1 / 5
or, A = 5 -1
Therefore, logA = log(5-1) = -log5 < 0
a * b * c > 1
=> log(a * b * c) > log(1)
=> loga + logb + logc > 0, since log1 = 0
now the solution reduces to, if the logarithm of the multiplication of the exchange rates of certain currencies that form a cycle is greater than ZERO, then we have an arbitrage.
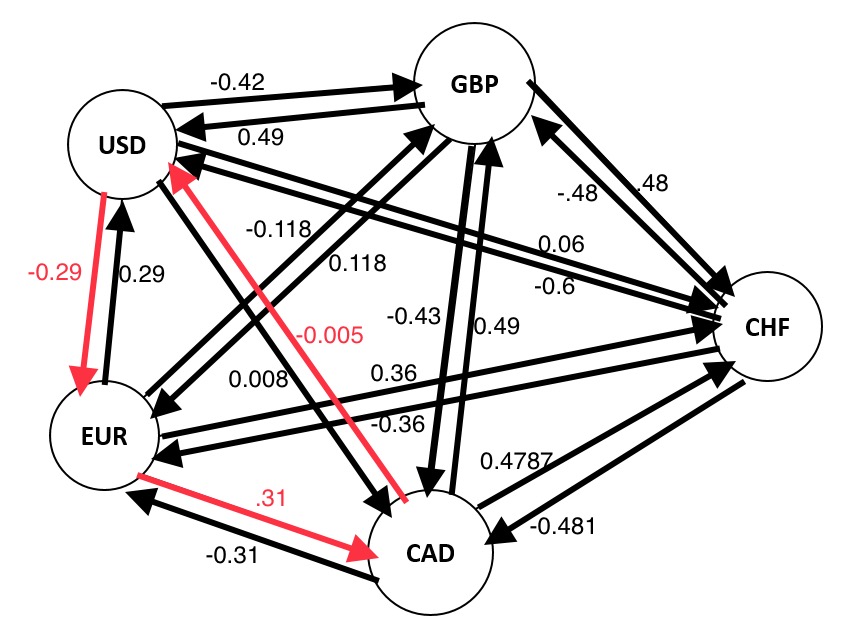
Or, as we have seen above: if the summation of the logarithm of each of the exchange rates is greater than ZERO, then we have an arbitrage. Which brings us to the conclusion: if we modify the graph and make the edge weights represent the logarithm of the exchange rates, then an arbitrage will form a cycle with summation of all the edges forming the cycle to be greater than ZERO. In short arbitrage will form a positive weight cycle. So if we have exchange rates as, say, A, B and C. In our previous graph A, B and C would be weights of 'three edges. Now as per our above discussion we will modify the graph and the weights of those same edges will be logA, logB and logC instead of being A, B and C. The graph would now look like this when we take log base e or ln:

We have earlier seen that USD -> EUR -> CAD -> USD forms an arbitrage. Let's see what the summation of the edge weights yield now.
Edge weight for USD -> EUR = ln (0.741) = -0.2998
Edge weight for EUR -> CAD = ln (1.366) = 0.3119
Edge weight for CAD -> USD = ln (0.995) = -0.005
(-0.2998) + (0.3119) + (-0.005) = 0.0071 > 0
So we got the summation to be greater than ZERO, as expected.
So now the solution is reduced to finding a positive weight cycle in the modified graph
We just discussed in previous two chapters how Bellman-Ford Algorithm very efficiently finds negative weight cycle in a graph. So why not take advantage of that? We could modify the graph to convert the problem from finding positive weight cycle to a fining negative weight cycle. We can achieve this by negating weights of all the edges.
Algorithm:
-
Create a directed graph in which the vertices are the currencies and the weight of the edges are the negated logarithm of
the exchange rate of the currencies represented by the vertices the edge connect.
For example, if exchange rate for currency A to currency B is E then in the graph the directed edge connected A to B will have weight of (-lnE). - Find if there is a negative weight cycle.
Implementation #1
This implementation is based on our discussion in the Bellman-Ford Algorithm & Negative Cycle Detection chapter.Login to Access Content
Implementation #2
The below implementation is heavily based on the implementation discussion we had in Optimized Bellman-Ford Algorithm chapter.Login to Access Content
Time Complexity:
same as that of Bellman-Ford ALgorithm: O(EV). The graph representing relationship between currencies are dense graph so E = O(V * V). So overall time complexity O(V3), where V = total number of vertices in the graph, E = total number of edges in the graph. V = total number different kinds of currencies in the given problem.Note:
Even in the absence of an arbitrage, the above understanding will come handy.Say, we want to convert currency A to currency Z and there are several ways of reaching Z from A. Basically if we have a graph with vertices representing the currencies and the edge weights the exchange rates, the graph has more than one distinct path from A to Z. In this case, we are to find which path would be the most profitable then that would mean maximizing the result of the multiplication of the exchange rates.
This would mean if we modify the graph make the edge weights represent the logarithm of the exchange rates then this would mean that the longest path from A to Z would give us the most profitable way to convert.
When we modify the graph further and make the edge weights represent negated logarithm of the exchange rates then the shortest path between two currencies will give you the most profitable path of conversion between the two currencies.
It's amazing how the Arbitrage problem reduces currency conversion to a shortest-paths problem which helps us solve (1) finding existence of any arbitrage, as well as (2) finding most profitable way to convert currency A to currency B.
Related Chapters:
- Dijkstra's Algorithm
- Longest Paths Algorithm
- Topological Sort w/ Vertex Relaxation
- Bellman-Ford Algorithm & Negative Cycle Detection
- Optimized Bellman-Ford
- Sequential Job Scheduling
- Parallel Job Scheduling
- Parallel Job Scheduling
w/ Relative Deadlines
